




- Published on: 2026-09-16 16:51:19
How to Measure Copy Trader Performance: The 2026 Institutional Guide

A 500% annual return is often the most dangerous metric in social trading. While it looks like a gold mine on a leaderboard, it's usually a siren song leading straight to a catastrophic account blow-up. You've likely felt the sting of following a "top-ranked" trader only to watch their high-risk martingale strategy erase your capital in a single afternoon. It's exhausting to sift through conflicting data while trying to distinguish between genuine skill and blind luck. In a landscape where over half of retail CFD accounts lose money, precision is your only defense.
Learning how to measure copy trader performance with institutional precision is the only way to protect your wealth and achieve long-term stability. You deserve a strategy that prioritizes risk-adjusted returns over vanity metrics. This guide provides the rigorous analytical frameworks used by elite investors to identify consistent market leaders. We will explore the critical metrics that matter in 2026, including the Sharpe ratio and recovery factors. You'll gain a definitive checklist to evaluate any trader for your Rookie or Pro account, ensuring your portfolio remains a safe haven in a high-stakes environment.
Key Takeaways
- Look past raw ROI to uncover the hidden risks and survivorship bias that often mask dangerous gambling behaviors.
- Master the professional framework for how to measure copy trader performance by prioritizing the Sharpe Ratio and Maximum Drawdown over vanity profit figures.
- Recognize the "staircase" effect in equity curves to distinguish consistent, professional trade management from short-term luck.
- Create a high-performance scorecard that filters for account longevity and historical trade volume to ensure long-term portfolio stability.
- Utilize TradingPRO’s specialized accounts to test these rigorous metrics within a secure, institutional-grade social trading ecosystem.
Beyond the ROI: Why Total Profit is a Dangerous Metric
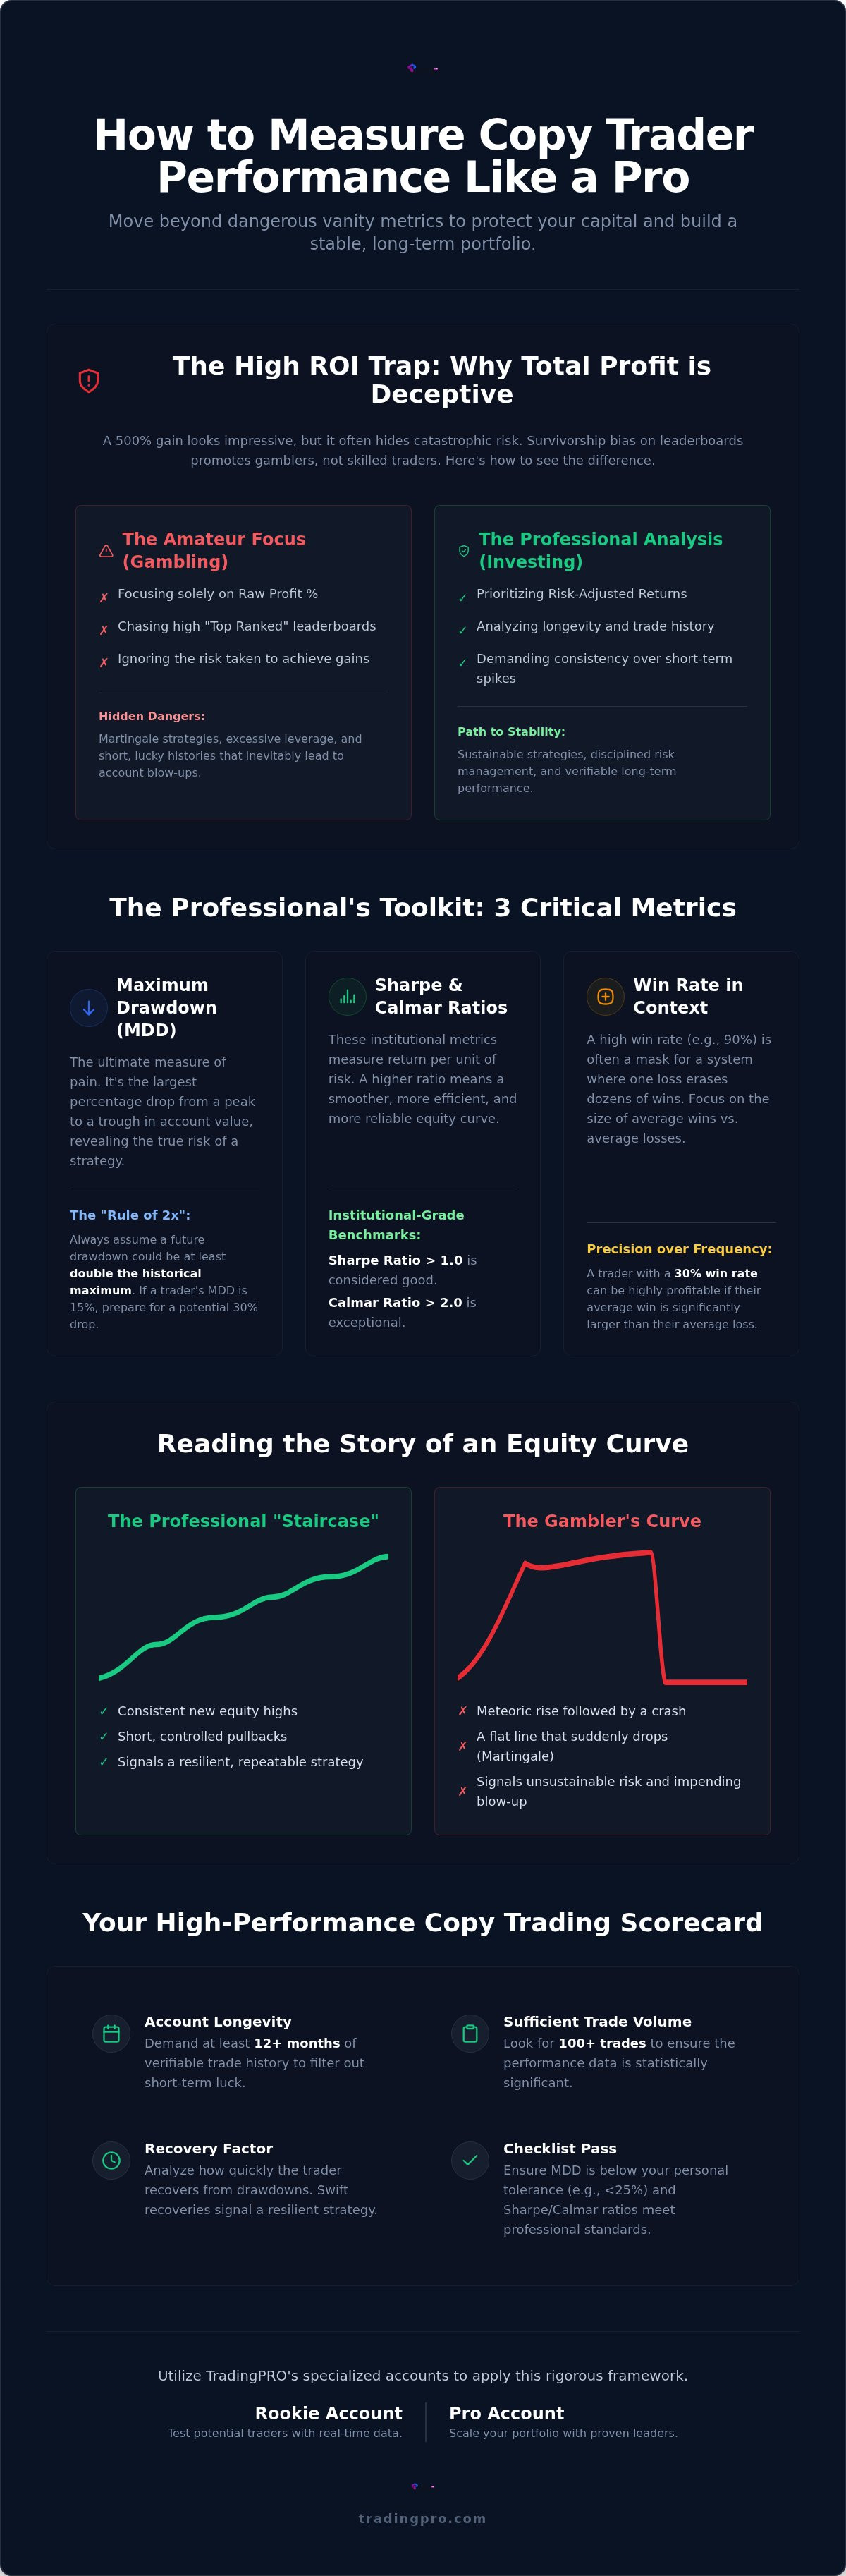
Raw profit is the ultimate vanity metric. It lures investors into a false sense of security while masking the structural rot of a failing strategy. Many investors focus solely on the "Gain" percentage, but a 200% return is worthless if it requires a 90% drawdown to achieve. This is the fundamental flaw in most amateur approaches to social trading. Mastering how to measure copy trader performance means looking past these surface-level gains to identify the risk-adjusted consistency beneath the numbers.
Survivorship bias creates a distorted reality on most leaderboards. You see the winners who haven't crashed yet, but you don't see the thousands of identical accounts that blew up last week. This "lottery" effect rewards lucky gamblers who use excessive leverage, positioning them as market leaders until their luck runs out. Professional growth is sustainable; gambling is just a countdown to zero. Understanding how to measure copy trader performance requires shifting your focus from absolute numbers to institutional standards of risk management.
The Trap of the "Top Ranked" Leaderboard
Leaderboards are often dominated by high-leverage traders who prioritize speed over security. These accounts often show meteoric rises that are mathematically unsustainable. You should demand at least 12 months of verifiable trade history before committing significant capital. Without this longevity, you're just betting on a hot streak rather than a proven system. Be particularly wary of "Martingale" strategies that show a deceptively flat profit line by adding to losing positions. These systems look invincible until a single market shift wipes out the entire balance in seconds.
Absolute Profit vs. Relative Performance
Total profit doesn't exist in a vacuum. If a trader earns 10% while the S&P 500 gains 15%, they've actually underperformed the market. True skill is measured through "Alpha." In the context of copy trading, Alpha is the excess return a trader generates over a specific market benchmark. If they aren't beating the benchmark, your capital is better served elsewhere. Serious investors use the Rookie Account at TradingPRO to test these benchmarks in a live environment without overextending. It's about finding traders who create value through precision, not just those who ride a general market trend.
The Big Three Metrics: Drawdown, Sharpe Ratio, and Win Rate
To achieve elite status in social trading, you must move beyond the amateur obsession with win rates. Professional investors prioritize structural stability over cosmetic success. Understanding how to measure copy trader performance involves a deep dive into risk-adjusted data. This is where you separate the consistent market leaders from the lucky gamblers. You need a framework that values the quality of a return as much as the quantity.
A high win rate is often a strategic mask for poor risk management. A trader with a 90% win rate might be using a dangerous system where one catastrophic loss erases months of gains. Conversely, a professional with a 30% win rate can dominate the market if their average win is significantly larger than their average loss. Precision beats frequency every time. Watch the recovery time closely; it measures how long a trader remains in a slump before reaching a new equity high. Institutional-grade traders bounce back with surgical precision, signaling a resilient strategy.
Mastering Maximum Drawdown (MDD)
Maximum Drawdown is the ultimate measure of a trader's pain threshold. It records the largest peak-to-trough decline in account value during a specific period. Apply the "Rule of 2x" here. Always assume the future drawdown will be at least double the historical maximum. This conservative approach prevents account blow-ups. Use this data to calibrate your Rookie Account risk settings. By aligning your copy ratios with historical MDD, you ensure your portfolio remains a safe haven during market turbulence.
Sharpe and Calmar Ratios: The Institutional Edge
The Sharpe Ratio simplifies complex volatility into a single, actionable number. It tells you exactly how much excess return you earn for every unit of volatility you endure. A higher number indicates a smoother, more reliable equity curve. If you want a sharper edge, look at the Calmar Ratio. This metric compares annual return directly to the Maximum Drawdown. In the institutional world, a Calmar Ratio above 2.0 is considered exceptional. It proves the trader can generate significant momentum without exposing capital to excessive heat. These metrics provide the clarity needed to scale your portfolio with confidence. You can register your profile now to start filtering for these high-performance leaders using professional-grade analytical tools.
Analyzing Equity Curves: Identifying Consistency vs. Luck
Visualizing an equity curve provides a window into a trader’s psychological discipline. It reveals whether profit is the result of a repeatable system or a series of fortunate accidents. When you evaluate how to measure copy trader performance, you must demand a smooth upward trajectory rather than erratic spikes. A "staircase" effect, characterized by consistent gains followed by brief periods of flat consolidation, is the hallmark of professional trade management. It proves the trader understands when to stay out of the market as much as when to enter.
Spotting "outlier" trades is a critical step in your analysis. If a single trade accounts for a massive portion of a trader's annual profit, their performance is likely a statistical fluke. You are looking for a high Consistency Score. This metric measures the standard deviation of monthly returns. Lower deviation signals a predictable, institutional-grade strategy. High deviation suggests a gambler who is one bad day away from a total account collapse. Professional investors prioritize the reliability of the process over the magnitude of a single win.
Red Flags in Visual Performance Data
Vertical spikes on a chart are often red flags for news gambling or reckless over-leveraging. These patterns are unsustainable and usually precede a vertical drop. Similarly, long periods of stagnation followed by a flurry of aggressive trades suggest "revenge trading." This psychological breakdown is a leading cause of account blow-ups. Use the Trade Hub to overlay performance curves and identify these hidden vulnerabilities before they impact your capital. Precision tools allow you to see the cracks in a strategy before the market exploits them.
Trade Duration and Frequency
Your chosen strategy must align with your account infrastructure. Scalpers require high-frequency execution and minimal slippage to remain profitable. If you copy a high-speed trader on a slow platform, the price difference will erode your margins. Our Scalp Account is specifically engineered for these high-octane environments. Swing traders, conversely, prioritize long-term trends and are better suited for different account types. Matching the trader’s frequency to your execution environment is a non-negotiable step in mastering how to measure copy trader performance effectively. This alignment ensures that the performance you see on the leaderboard is the performance you actually receive in your account.
How to Build Your Copy Trading Performance Scorecard
Stop guessing. Success in social trading requires a standardized evaluation framework. While many platforms offer vague, proprietary risk scores, you need a customized scorecard that reflects institutional rigor. Learning how to measure copy trader performance effectively is about building a repeatable process that filters out the noise. This ensures you only allocate capital to traders who demonstrate structural stability.
Longevity is your first filter. Require at least 12 months of history and a minimum of 100 closed trades to ensure the data is statistically significant. Next, set a hard limit on Maximum Drawdown. Institutional standards usually cap this at 20%. Any trader exceeding this threshold is taking "heat" that could eventually lead to total liquidation. Cross-reference their performance with current market volatility to see if they can adapt to shifting conditions. Finally, verify "skin in the game." If a trader isn't risking significant personal capital, they lack the incentive to protect yours during a crisis.
The Profit Factor Calculation
The Profit Factor is the ratio of gross profit to gross loss. It's a pure measure of efficiency that reveals the true quality of a strategy. Aim for a "sweet spot" above 1.5. A profit factor of 2.0 means the trader earns $2 for every $1 lost. This provides a vital buffer for the inevitable losing streaks that every trader faces. For more advanced protection techniques, read our guide on Managing Drawdown to secure your portfolio against unexpected shifts.
Execution Alignment and Slippage
Even a perfect trader can't save you from poor infrastructure. This is where many copiers fail. The master trader's profit rarely matches your account's profit exactly due to broker spreads and execution latency. This difference is known as slippage. High-speed strategies require institutional-grade execution to minimize this gap. If your broker's latency is too high, you'll enter trades late and exit early. This turns a winning strategy into a losing one. Precision execution is the backbone of successful social trading. You need a platform that prioritizes speed to ensure your results align with the leaders you follow. Open your TradingPRO account today and deploy your scorecard against our top-performing traders with total confidence.
Executing Your Strategy with TradingPRO’s Social Ecosystem
Rigorous analysis is only half the battle. To transform your scorecard into a profit engine, you need a professional environment that respects your data. TradingPRO provides the high-performance infrastructure required to execute your findings with institutional precision. Our multi-tiered account structure ensures that every investor finds a perfect fit. Whether you utilize a Pro Account for significant capital or a Micro Account for smaller allocations, our ecosystem prioritizes execution speed and security above all else. This is where your strategy meets the global market.
The Rookie Account is your most powerful tool for initial validation. It serves as a sophisticated testing ground where you can apply your knowledge of how to measure copy trader performance without overextending. Deploy your diversified portfolio here first. Monitor how the theoretical metrics you've calculated translate into live equity growth. Once your chosen traders prove their consistency within our ecosystem, you can scale your positions with total confidence. Precision testing is the hallmark of an elite investor.
Professional Infrastructure for Elite Replication
Latency is the silent killer of copy trading profits. If your execution lags, you'll never replicate the master trader's curve. Our ScalpX environment is engineered for high-frequency execution, virtually eliminating the slippage that erodes amateur accounts. You're trading within a multi-asset brokerage founded in 2017, benefiting from years of institutional refinement. This "safe-haven" infrastructure ensures that your account mirrors the leader's performance with surgical accuracy. Ready to build your elite portfolio? Register for your TradingPRO account now.
Continuous Monitoring and Re-Balancing
Successful social trading is an active pursuit. Measuring performance is a recurring weekly task, not a "set and forget" operation. Markets shift, and even elite traders can lose their edge. Use TradingPRO’s integrated tools to track your portfolio in real-time. If a trader’s Sharpe ratio drops or their drawdown exceeds your scorecard’s limits, re-balance your capital immediately. Discipline is your greatest competitive advantage. For a deeper look at different platform styles, explore our guide on Social Trading vs Copy Trading. Mastering how to measure copy trader performance is a continuous journey that rewards the vigilant. Stay proactive, stay precise, and let our technology facilitate your ascent to market leadership.
Secure Your Financial Future with Precision Analytics
Mastering how to measure copy trader performance is the definitive line between a gambler and an institutional-grade investor. You now possess the analytical frameworks to look past vanity ROI and identify true market leaders through risk-adjusted metrics like the Sharpe ratio and maximum drawdown. Consistency is your new benchmark. By prioritizing smooth equity curves and high profit factors, you protect your capital while positioning yourself for sustainable, long-term growth.
TradingPRO provides the high-performance environment required to execute this professional strategy. You gain access to institutional-grade execution speed and a multi-asset social trading ecosystem designed for peak performance. Whether you're starting with a Rookie account or scaling to a Pro account, our infrastructure ensures your copy results align perfectly with the leaders you follow. Don't leave your wealth to chance when you can lead with data.
Master the markets and start copying elite traders today. Your journey toward market dominance begins with a single, decisive action. We are ready to facilitate your success every step of the way.
Frequently Asked Questions
What is a good Sharpe Ratio for a copy trader?
A Sharpe Ratio above 1.0 is considered good; anything exceeding 2.0 is institutional-grade. This metric reveals exactly how much excess return you earn for every unit of volatility you endure. When you analyze how to measure copy trader performance, prioritize traders with consistent ratios over those with erratic spikes. High ratios indicate a smoother equity curve and professional risk management that protects your capital during turbulent market shifts.
How much drawdown is considered "safe" in copy trading?
A "safe" maximum drawdown typically stays below 15% to 20% for conservative strategies. If a trader exceeds 25%, the risk of a total account blow-up increases significantly. Always apply the "Rule of 2x" by assuming the future drawdown will be double the historical peak. This conservative buffer is essential for protecting your capital in high-volatility environments and ensures your portfolio remains a secure safe-haven for your hard-earned wealth.
Why is my profit lower than the trader I am copying?
Discrepancies usually stem from slippage, broker spreads, and execution latency. Even milliseconds of delay can cause you to enter at a slightly worse price than the master trader. Using institutional-grade infrastructure like our Scalp Account minimizes these gaps effectively. Additionally, differences in account leverage or proportional trade sizing can result in lower relative gains compared to the signal provider. Precision execution is the only way to align your results.
Can I lose more than my deposit in copy trading?
Your losses will never exceed your initial deposit due to Negative Balance Protection. TradingPRO ensures that your account balance cannot drop below zero, even during extreme market movements. While copy trading involves significant risk, this safety mechanism provides a secure floor for your investment. It acts as a critical safety feature within our high-performance social trading ecosystem, allowing you to pursue ambitious goals with a reassuring level of security.
How many traders should I copy at once for diversification?
Diversifying across three to five uncorrelated traders is the institutional standard for a balanced portfolio. Copying too many traders can lead to "over-diversification," which dilutes your potential returns and complicates your monitoring efforts. Aim for a mix of styles, such as combining a high-frequency scalper with a long-term swing trader. This balanced approach stabilizes your portfolio by ensuring that one trader's drawdown doesn't paralyze your entire investment strategy.
Does past performance guarantee future results in social trading?
Historical success is a powerful indicator of skill but never a guarantee of future profits. Markets are dynamic; a strategy that dominated last year may struggle in a different volatility regime. This is why learning how to measure copy trader performance is an ongoing process for serious investors. You must continuously verify that a trader’s current behavior aligns with the rigorous metrics and analytical frameworks that initially earned your trust and capital.
How often should I review my copied traders’ performance?
Review your portfolio at least once a week to ensure your traders remain within their historical risk parameters. Social trading is not a "set and forget" investment for those seeking elite results. Use our Trade Hub to monitor real-time data and detect early warning signs like sudden spikes in drawdown. Proactive management allows you to re-allocate capital swiftly before a trader's performance degrades beyond your scorecard’s acceptable limits.


